Hydration without the hype
Fluid physiology, intake guidelines, what counts towards hydration, the risks of over-drinking, and evidence-based monitoring of hydration status
Companion to: Eat Well Open Post 2-5 — Hydration without the hype: keeping your fluids up. This Deep Dive examines the evidence base in greater technical depth. Readers seeking the accessible introduction should begin with the Open Post.
Key takeaways
Total water intake guidelines of approximately 2.7 litres per day for women and 3.7 litres per day for men (from all sources) are well supported by clinical and population research and represent the most widely cited reference framework for healthy adults. Meaningful individual variation exists based on body size, activity level, climate, and health status.
Fluid balance is primarily regulated by thirst, anti-diuretic hormone (ADH), and the kidneys, not by adherence to fixed daily targets. In healthy adults, these mechanisms are highly effective under ordinary conditions, and thirst is a reliable guide for most people most of the time.
Food contributes approximately 20 per cent of total daily water intake; non-water beverages contribute a further substantial share. Habitual consumption of tea and coffee at normal doses does not produce net dehydration; their fluid content outweighs the mild diuretic effect of caffeine at typical intake levels.
Exercise-associated hyponatraemia (EAH) — a dangerous dilution of blood sodium caused by over-drinking — is a real clinical risk in endurance settings and is now the subject of position statements advising athletes to drink to thirst rather than to prescribed volumes. This finding also provides broader support for thirst-based guidance in everyday life.
Urine colour is validated as a practical, low-cost hydration monitoring tool, with strong correlations to urine osmolality and specific gravity across multiple studies. Pale yellow urine is the appropriate target; colourless urine may indicate over-hydration; amber or darker urine indicates under-hydration.
Modest dehydration of up to approximately 2–3 per cent of body mass loss is generally tolerated in healthy adults without serious clinical consequence, though cognitive performance and physical endurance are measurably affected at or above 2 per cent loss. Severe dehydration (≥5%) carries significant clinical risks.
This Deep Dive accompanies Open Post 2-5 of Eat Well. It examines the physiology of fluid balance, the evidence underpinning recommended intake levels, the question of what beverages and foods count towards hydration, the clinical risks of both under- and over-hydration, and the practical evidence base for monitoring hydration status. Where the Open Post presents accessible guidance, this post engages the mechanistic and epidemiological detail. Methodological limitations are noted where they bear on interpretation.
1. The physiology of fluid balance
Body water and its functions
Water constitutes approximately 60 per cent of total body mass in adult males and around 50–55 per cent in adult females, with variation according to body composition (adipose tissue contains proportionally less water than lean mass). It is the universal biological solvent: virtually all biochemical reactions occur in aqueous solution. Functionally, water serves as the medium for nutrient and oxygen transport via the bloodstream, the substrate for metabolic reactions, the vehicle for renal excretion of waste products, the primary mechanism of thermoregulation through evaporative cooling, a cushioning fluid in joints and around organs, and the medium of electrical conductance in neurons and muscle cells.
Hormonal regulation: ADH, renin-angiotensin, and aldosterone
Fluid balance is regulated with considerable precision by the hypothalamus and kidneys in concert with several hormonal systems. The primary regulator of water retention is anti-diuretic hormone (ADH, also called vasopressin), released from the posterior pituitary in response to rising plasma osmolality — the concentration of solutes in the blood. When plasma osmolality rises above a threshold of approximately 280–290 mOsm/kg (as occurs with dehydration), ADH release increases, promoting water reabsorption in the renal collecting ducts and reducing urine output. Osmolality falling below this threshold suppresses ADH, promoting diuresis.
The renin-angiotensin-aldosterone system (RAAS) regulates fluid volume through a complementary pathway: renal renin release (triggered by low blood pressure or low sodium delivery to the kidney) activates angiotensin II, which promotes sodium reabsorption and stimulates aldosterone release from the adrenal cortex. Aldosterone promotes further sodium reabsorption in the distal nephron, with water following osmotically. Together, these systems ensure that mild variations in intake are compensated rapidly and efficiently, without requiring deliberate calculation by the individual.
The implications for practical guidance are significant. In healthy adults with intact renal function, the body’s homeostatic mechanisms are highly effective at maintaining fluid balance across a wide range of intakes. The priority signal for drinking in healthy individuals is thirst — a physiological response triggered by hypothalamic osmoreceptors and baroreceptors — rather than adherence to externally specified volumes.
KEY RESEARCH
Armstrong, L., & Johnson, E. (2018). Water intake, water balance, and the elusive daily water requirement. Nutrients, 10. https://doi.org/10.3390/nu10121928
This review provides a thorough account of the physiology of fluid balance, the limitations of population-level intake recommendations, and the central role of thirst and renal regulation in maintaining euhydration. The authors argue that the concept of a single universal daily water requirement is physiologically problematic, given the degree of individual variation driven by body size, activity, climate, and diet composition.
2. Intake guidelines: what the evidence supports
The National Academy of Medicine reference values
The most widely cited reference framework for daily fluid intake in the English-speaking world is the National Academy of Medicine (NAM) Adequate Intake (AI) values: 3.7 litres of total water per day for adult men and 2.7 litres per day for adult women. These figures represent total water from all sources — plain water, other beverages, and food — rather than a target for plain water consumption alone. The NAM AI is defined as the average intake in a population presumed to be adequately hydrated rather than as an experimentally derived minimum requirement, which is an important distinction when interpreting its clinical relevance.
Research has confirmed that a substantial proportion of healthy adults consuming typical Western diets meet or exceed these values when total dietary water (including food moisture) is considered, even among those who do not consciously track fluid intake. Seal et al. (2022), in an analysis of US adults, found that total water intake guidelines were sufficient for optimal hydration when assessed against objective biomarkers including urine osmolality.
KEY RESEARCH
Seal, A., Colburn, A., Johnson, E., Péronnet, F., Jansen, L., Adams, J., Bardis, C., Guelinckx, I., Perrier, E., & Kavouras, S. (2022). Total water intake guidelines are sufficient for optimal hydration in United States adults. European Journal of Nutrition, 62, 221–226. https://doi.org/10.1007/s00394-022-02972-2
Using validated biomarkers of hydration status in a US sample, this study found that adherence to NAM total water intake guidelines was associated with optimal hydration as assessed objectively. Critically, the findings support total fluid intake (from all sources) rather than plain water consumption as the relevant target metric.
Variation by individual and circumstance
Population-level reference values mask considerable individual variation. Body mass is the most direct determinant of absolute water need, since lean body mass has higher water content than adipose tissue. Physical activity increases water needs through sweat losses that can range from 0.5 to over 2 litres per hour depending on exercise intensity, environmental temperature, and individual sweating rate. Ambient temperature and humidity independently increase insensible losses. Fever, vomiting, and diarrhoea can impose acute fluid deficits at rates that rapidly exceed normal intake capacity if fluid replacement is not deliberately increased.
Pregnancy increases total water needs by approximately 0.3 litres per day; lactation by approximately 0.7–1.1 litres per day above baseline, reflecting milk volume production. Older adults represent a particular concern: the sensitivity of the thirst mechanism declines with age (a phenomenon sometimes termed hypodipsia of ageing), meaning that older individuals may become dehydrated before experiencing subjective thirst. This impairs the reliability of thirst as a monitoring signal in this population group.
3. What counts: beverages, food, and the caffeine question
Dietary water: food and beverage contributions
Total daily water intake comprises three sources: drinking water, other beverages, and the moisture content of food. Analyses of dietary intake data from US national surveys suggest that food contributes approximately 20–22 per cent of total water intake in adults eating a varied diet, with fruits and vegetables (which contain 85–95 per cent water by weight) making the largest food-source contribution. Non-water beverages — including tea, coffee, milk, juice, and other drinks — contribute a further substantial share that, in surveys of young US adults, has been estimated at 35–44 per cent of total fluid intake.
Coffee, tea, and the caffeine-diuresis question
The persistent belief that caffeinated beverages do not count towards hydration — or actively dehydrate — is not well supported by the current evidence base at normal consumption levels. The diuretic effect of caffeine is dose-dependent and is primarily observed at acute doses exceeding approximately 250–300 mg (equivalent to two to three standard cups of coffee consumed at once). At these doses, caffeine inhibits adenosine receptors in the kidney, transiently reducing ADH-mediated water reabsorption and increasing urine output.
Crucially, however, the diuretic effect is attenuated by habituation in regular consumers and does not, at typical daily intake levels, produce a net negative fluid balance. The water contained in a standard cup of coffee or tea substantially exceeds the additional urinary losses attributable to caffeine at normal doses. Maughan and Griffin (2003), in a widely cited review, concluded that caffeinated beverages consumed at normal levels make a positive net contribution to daily fluid intake in habitual consumers.
The practical implication is that individuals eating diets containing substantial amounts of fruit and vegetables and consuming a variety of beverages across the day are likely covering a large proportion of their fluid needs through dietary pattern alone, independent of any deliberate hydration strategy.
KEY RESEARCH
Seal, A., Bardis, C., Gavrieli, A., Grigorakis, P., Adams, J., Arnaoutis, G., Yannakoulia, M., & Kavouras, S. (2017). Coffee with high but not low caffeine content augments fluid and electrolyte excretion at rest. Frontiers in Nutrition, 4. https://doi.org/10.3389/fnut.2017.00040
This controlled trial compared the effects of high-caffeine coffee (~6 mg/kg body weight), low-caffeine coffee, and water on urine output and fluid balance. Only the high-caffeine condition produced significantly increased urine output compared with water. At lower caffeine doses representative of ordinary consumption, no significant difference in fluid balance was observed, supporting the conclusion that habitual coffee drinking at typical levels does not impair hydration.
Alcohol is the notable exception to the general conclusion that beverages contribute positively to hydration. Ethanol suppresses ADH release, producing a diuretic effect that is not offset by the water content of alcoholic drinks. Alcoholic beverages should generally not be counted towards daily fluid targets, and consumption of alcohol during periods of increased fluid need (such as exercise or hot weather) is particularly inadvisable.
4. Exercise-associated hyponatraemia and the risks of over-drinking
The clinical and research literature on hydration has increasingly emphasised the risks of over-drinking, prompted by a series of serious and fatal adverse events in endurance sport associated with excessive hypotonic fluid consumption. Exercise-associated hyponatraemia (EAH) is defined as serum sodium below 135 mmol/L occurring in the context of prolonged exercise. In severe cases, EAH produces cerebral oedema, with symptoms including confusion, seizure, and, in extreme cases, death from cerebral herniation.
The primary mechanism of EAH is not sodium depletion per se but the dilution of plasma sodium through the consumption of large volumes of hypotonic fluid (plain water or low-sodium sports drinks) at rates exceeding sweat-rate fluid losses — a phenomenon sometimes described as dilutional hyponatraemia. Slower participants in endurance events are at particular risk because their longer race duration provides more opportunity for cumulative over-drinking against a lower hourly sweat rate than faster athletes.
KEY RESEARCH
Hew-Butler, T., Loi, V., Pani, A., & Rosner, M. (2017). Exercise-associated hyponatremia: 2017 update. Frontiers in Medicine, 4. https://doi.org/10.3389/fmed.2017.00021
This position statement update from the International Exercise-Associated Hyponatraemia Consensus Development Conference provides a comprehensive account of EAH epidemiology, pathophysiology, prevention, and management. The statement explicitly recommends that athletes drink to thirst rather than to prescribed fluid volumes, on the grounds that thirst-guided drinking prevents both dehydration and over-hydration in the majority of exercisers.
The public health relevance of EAH research extends beyond competitive sport. The findings provide strong mechanistic and clinical justification for the recommendation that thirst, rather than fixed intake targets, should guide fluid consumption. They also caution against wellness messaging that frames very high fluid intakes as inherently beneficial — a position not supported by physiology or clinical evidence in otherwise healthy adults.
Klingert et al. (2022), reviewing EAH in marathon runners, found that EAH is more common than often appreciated: prevalence estimates across marathon studies ranged from 1 to 13 per cent of finishers depending on the race and the sodium threshold applied. Female sex, slower pace, non-steroidal anti-inflammatory drug (NSAID) use, and large volumes of fluid consumption were consistently identified risk factors.
5. Monitoring hydration status: the evidence for urine colour
Objective assessment of hydration status in clinical and research settings typically involves measurement of urine osmolality (the concentration of solutes per kilogram of urine), urine specific gravity (a related measure of urine density), or plasma osmolality. These are accurate but require laboratory equipment. For practical everyday use, urine colour has been validated as a useful surrogate marker.
The relationship between urine colour and urine osmolality has been established across multiple studies using the Armstrong Urine Color Scale, an 8-point visual scale ranging from pale straw (1) to dark amber (8). Urine colours in the range of 1–3 (pale to slightly yellow) correspond to adequate or optimal hydration (osmolality below approximately 500 mOsm/kg); colours of 4–5 suggest mild under-hydration; colours of 6–8 indicate significant dehydration.
KEY RESEARCH
Armstrong, L., & Johnson, E. (2018). Water intake, water balance, and the elusive daily water requirement. Nutrients, 10. https://doi.org/10.3390/nu10121928 — and — Sekiguchi, Y., Benjamin, C., Butler, C., Morrissey, M., Filep, E., Stearns, R., Lee, E., & Casa, D. (2021). Relationships between WUT (body weight, urine color, and thirst level) criteria and urine indices of hydration status. Sports Health, 14, 566–574. https://doi.org/10.1177/19417381211038494
The WUT (Weight, Urine colour, Thirst) framework, assessed in Sekiguchi et al. (2021), was validated against objective urine indices and found to provide a clinically useful composite tool for monitoring hydration status in athletes. Urine colour alone showed strong correlations with urine osmolality and specific gravity. Armstrong and Johnson (2018) provide the foundational evidence base for urine colour as a monitoring tool in both clinical and field settings.
Belasco et al. (2020) evaluated urine colour using objective colorimetric measurement (CIE L*a*b* colour space) rather than visual comparison, finding strong correlations between objectively measured urine colour and osmolality across a range of hydration conditions. Feng et al. (2022) extended this validation to an athletic population, confirming that urine colour measurement is a robust hydration monitoring approach in sporting contexts.
The practical guidance that follows from this evidence — that pale yellow urine indicates adequate hydration, dark yellow or amber urine indicates under-hydration, and colourless urine may suggest over-hydration — is well supported, accessible, and requires no equipment. It is a reasonable primary monitoring strategy for most healthy adults in most everyday settings.
6. Consequences of dehydration: dose-response and clinical thresholds
The physiological and functional consequences of dehydration are well established and show a broadly dose-dependent pattern. At mild levels of fluid deficit — defined as body mass loss of 1–2 per cent — early symptoms including thirst, headache, and mild fatigue are typical. Cognitive function — particularly attention, short-term memory, and reaction time — has been shown to be measurably affected at approximately 2 per cent body mass loss in some studies, though effect sizes vary across the literature and are not consistently observed at the lower end of this range.
Physical performance, particularly endurance exercise capacity, is affected at around 2 per cent body mass loss with consistent findings across multiple studies. Aerobic capacity declines, thermoregulatory efficiency is impaired, and ratings of perceived exertion increase at equivalent workloads. These effects are more pronounced in warm environments, where evaporative cooling demands are higher.
Moderate dehydration (2–5% body mass loss) produces more significant symptoms: pronounced fatigue, dizziness, reduced urine output, increased heart rate, and reduced cognitive and physical capacity. At or above 5 per cent body mass loss, severe dehydration produces muscle cramps, delirium, and circulatory compromise; above 10–15 per cent, it is life-threatening. These severe levels are not encountered in ordinary daily life under normal conditions but can occur rapidly in clinical settings involving vomiting, diarrhoea, fever, or extreme heat exposure without fluid replacement.
Summary of the evidence
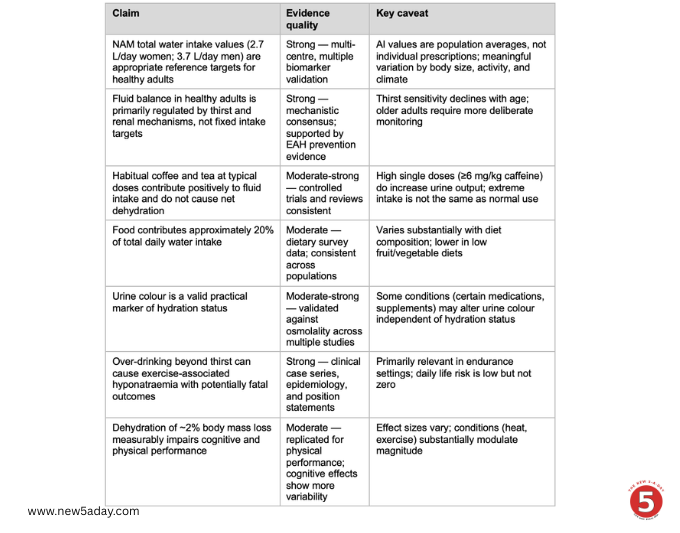
The evidence supports the following conclusions:
A note on medical advice: This Deep Dive is intended to inform and educate, not to replace professional medical guidance. If you have kidney problems, a heart condition, or any other health issue that affects how your body manages fluids, please speak to your GP or a qualified health professional before making significant changes to how much you drink.
The New 5-a-Day | Eat Well 2-5 | Live well. Every day.
